JavaScript Chart Without a Library
Four bars do not need Chart.js. Here's a canvas chart and an SVG chart in plain JavaScript, and the point where I install a library anyway.
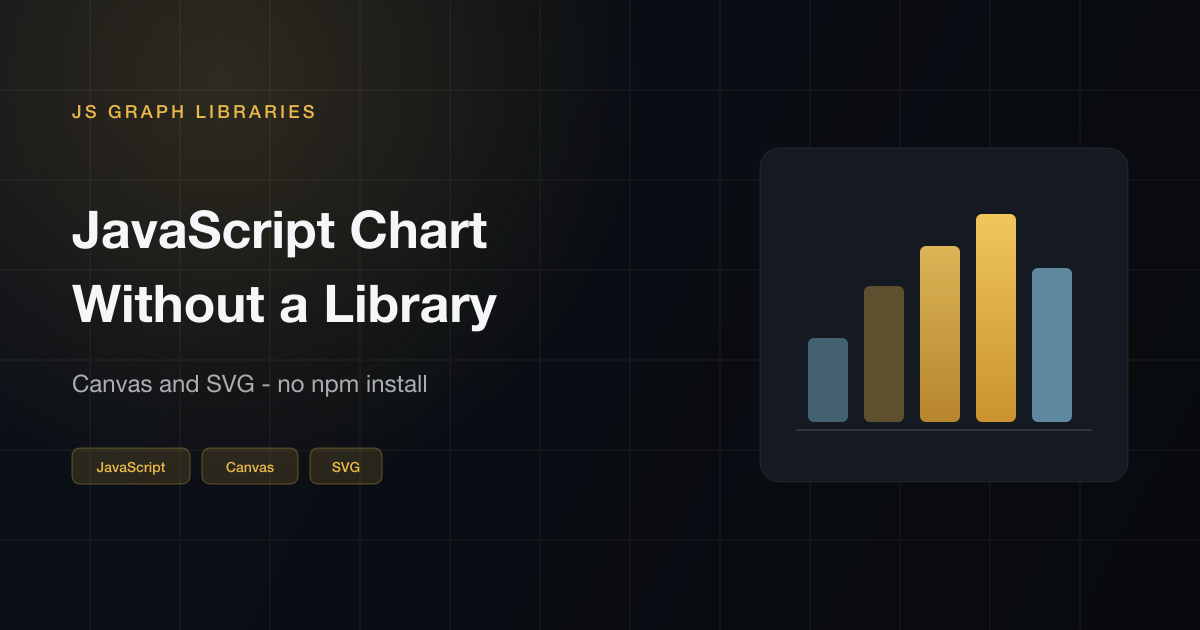
A JavaScript chart without a library is a perfectly normal thing to ship. I used to npm install Chart.js for four rectangles. That's a lot of package for a weekly bar chart on a status page.
The whole trick is a scale: value goes in, pixel comes out. After that you're drawing rectangles or a line. Below is an SVG bar chart (no JS required to see it) and a canvas line chart drawn with a few dozen lines of JavaScript.
If you actually need tooltips, time axes, and three chart types, skip to when I'd stop and install something. For a visual catalog of types, see JavaScript chart examples. The rest of this page is for the small case.
When a JavaScript chart without a library is enough
I skip the library when all of this is true:
- One chart, maybe two.
- A handful of categories or a short series, not 10,000 points.
- I can live without a fancy hover box.
- I don't want to explain a 200kb dependency in the PR.
Internal tools, a marketing page with one stat, a README-style demo: that's the list. A product dashboard is usually not. I wrote about picking a React graph library for that side of it.
Canvas vs SVG
Two built-in ways to draw. Neither is a library.
- SVG puts bars and labels in the DOM. You can color them with CSS, attach click handlers, and inspect them in devtools. Screen readers can see the text. I start here.
- Canvas is a bitmap. You paint pixels, then they're gone as far as the DOM is concerned. It stays smooth when the point count climbs. Hit-testing and a11y are on you.
D3 is the thing people reach for when this scale math gets annoying. D3 is still a library. You don't need it for the charts on this page.
SVG bar chart
Same data all the way down: page views, Mon through Sat. Find the max, turn each number into a height, park a label under the bar. That's the chart.
Preview
The preview above is just SVG in the page. The snippet builds the same
thing with createElementNS so you can feed it real data later.
Code
const data = [12, 19, 8, 15, 22, 11];
const labels = ["Mon", "Tue", "Wed", "Thu", "Fri", "Sat"];

const width = 640;
const height = 260;
const pad = { left: 44, right: 16, top: 16, bottom: 40 };
const innerW = width - pad.left - pad.right;
const innerH = height - pad.top - pad.bottom;
const max = Math.max(...data);
const slot = innerW / data.length;
const barW = slot * 0.55;

const svg = document.createElementNS("http://www.w3.org/2000/svg", "svg");
svg.setAttribute("viewBox", `0 0 ${width} ${height}`);
svg.setAttribute("role", "img");
svg.setAttribute("aria-label", "Page views this week");

data.forEach((value, i) => {
  const barH = (value / max) * innerH;
  const x = pad.left + i * slot + (slot - barW) / 2;
  const y = pad.top + innerH - barH;

  const rect = document.createElementNS("http://www.w3.org/2000/svg", "rect");
  rect.setAttribute("x", x);
  rect.setAttribute("y", y);
  rect.setAttribute("width", barW);
  rect.setAttribute("height", barH);
  rect.setAttribute("rx", "4");
  rect.setAttribute("fill", "#e8b84a");
  svg.appendChild(rect);

  const text = document.createElementNS("http://www.w3.org/2000/svg", "text");
  text.setAttribute("x", x + barW / 2);
  text.setAttribute("y", height - 14);
  text.setAttribute("text-anchor", "middle");
  text.setAttribute("fill", "#c8d0da");
  text.setAttribute("font-size", "12");
  text.textContent = labels[i];
  svg.appendChild(text);
});

document.querySelector("#chart").appendChild(svg);
Canvas line chart
Same numbers, different surface. You still compute x from the index and
y from the value. Then lineTo between the points and stamp a
circle on each one so the line doesn't look like a wire.
Preview
Code
const values = [12, 19, 8, 15, 22, 11];
const labels = ["Mon", "Tue", "Wed", "Thu", "Fri", "Sat"];

const canvas = document.querySelector("#chart");
const ctx = canvas.getContext("2d");
const w = canvas.width;
const h = canvas.height;
const pad = { left: 36, right: 12, top: 16, bottom: 32 };
const innerW = w - pad.left - pad.right;
const innerH = h - pad.top - pad.bottom;
const max = Math.max(...values);
const stepX = innerW / (values.length - 1);

ctx.strokeStyle = "#e8b84a";
ctx.lineWidth = 2.5;
ctx.lineJoin = "round";
ctx.beginPath();
values.forEach((n, i) => {
  const x = pad.left + i * stepX;
  const y = pad.top + innerH - (n / max) * innerH;
  if (i === 0) ctx.moveTo(x, y);
  else ctx.lineTo(x, y);
});
ctx.stroke();

values.forEach((n, i) => {
  const x = pad.left + i * stepX;
  const y = pad.top + innerH - (n / max) * innerH;
  ctx.beginPath();
  ctx.fillStyle = "#e8b84a";
  ctx.arc(x, y, 4, 0, Math.PI * 2);
  ctx.fill();
  ctx.fillStyle = "#c8d0da";
  ctx.font = "12px sans-serif";
  ctx.textAlign = "center";
  ctx.fillText(labels[i], x, h - 10);
});
The fiddly bits
The first chart looks easy. The second afternoon is axes, padding, and "why is Thursday clipped." A few things I write down every time:
- Padding is not optional. Labels need a gutter. If you draw from 0,0 the first point sits under the border.
- Zero should be zero. Scaling to the max only is fine for a trend. If 12 and 13 should look almost the same, keep the baseline at 0.
-
Don't hard-code the width. SVG with a viewBox scales.
Canvas needs a resize listener or you'll get a blurry rectangle on a
retina screen. The preview on this page sets
devicePixelRatio. -
Say what the chart is.
role="img"andaria-labelon the SVG. A<canvas>also needs a label, because the pixels mean nothing to a reader.
When to stop and use a library
I draw the chart myself until I start reinventing Chart.js. That usually happens at the first tooltip, or when someone asks for a stacked bar and a pie on the same screen.
| If you need | I'd do |
|---|---|
| One bar or line, static data | SVG or canvas, no library |
| Hover values, legend, mixed types | Chart.js |
| The same thing in React components | Recharts (examples) |
| A shape that is not a chart type | D3 or visx |
This site is mostly a catalog of libraries, on purpose. A JavaScript chart without a library is the exception, not the method. When the exception stops being exceptional, go back to the list.
Questions I get
Can I make a JavaScript chart without a library?
Absolutely. For a bar or line chart, canvas or SVG is more than enough. You map your values to pixel coordinates, draw rectangles or a path, add labels. I do this when the chart is simple and I don't want to pull in a dependency just to show five bars on a status page.
Should I use canvas or SVG for a chart with no library?
SVG is usually my first choice for simple charts — the elements live in the DOM, so you can style them with CSS, attach click and hover handlers, and inspect them in devtools. Canvas is better when you have a lot of data points and SVG starts to slow down, or when you need pixel-level control. For a simple weekly bar chart, SVG every time.
When should I stop and use Chart.js?
When you find yourself re-implementing things that libraries already solved well. For me that threshold is usually tooltips — writing a good hover tooltip from scratch is annoying. Legends, time axes that handle gaps correctly, and multiple chart types on the same screen are all the same story. At that point Chart.js (or Recharts if you're in React) is cheaper than writing it yourself and cheaper than maintaining it later.